<script>
import { scaleLinear } from 'd3-scale';
import points from './data.js';
const yTicks = [0, 2, 4, 6, 8];
const xTicks = [1980, 1990, 2000, 2010];
const padding = { top: 20, right: 15, bottom: 20, left: 25 };
let width = 500;
let height = 200;
$: xScale = scaleLinear()
.domain([minX, maxX])
.range([padding.left, width - padding.right]);
$: yScale = scaleLinear()
.domain([Math.min.apply(null, yTicks), Math.max.apply(null, yTicks)])
.range([height - padding.bottom, padding.top]);
$: minX = points[0].x;
$: maxX = points[points.length - 1].x;
$: path = `M${points.map(p => `${xScale(p.x)},${yScale(p.y)}`).join('L')}`;
$: area = `${path}L${xScale(maxX)},${yScale(0)}L${xScale(minX)},${yScale(0)}Z`;
function formatMobile (tick) {
return "'" + tick.toString().slice(-2);
}
</script>
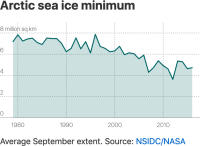
<h2>Arctic sea ice minimum</h2>
<div class="chart" bind:clientWidth={width} bind:clientHeight={height}>
<svg>
<!-- y axis -->
<g class="axis y-axis" transform="translate(0, {padding.top})">
{#each yTicks as tick}
<g class="tick tick-{tick}" transform="translate(0, {yScale(tick) - padding.bottom})">
<line x2="100%"></line>
<text y="-4">{tick} {tick === 8 ? ' million sq km' : ''}</text>
</g>
{/each}
</g>
<!-- x axis -->
<g class="axis x-axis">
{#each xTicks as tick}
<g class="tick tick-{ tick }" transform="translate({xScale(tick)},{height})">
<line y1="-{height}" y2="-{padding.bottom}" x1="0" x2="0"></line>
<text y="-2">{width > 380 ? tick : formatMobile(tick)}</text>
</g>
{/each}
</g>
<!-- data -->
<path class="path-area" d={area}></path>
<path class="path-line" d={path}></path>
</svg>
</div>
<p>Average September extent. Source: <a href='https://climate.nasa.gov/vital-signs/arctic-sea-ice/'>NSIDC/NASA</a></p>
<style>
.chart, h2, p {
width: 100%;
max-width: 500px;
margin-left: auto;
margin-right: auto;
}
svg {
position: relative;
width: 100%;
height: 200px;
overflow: visible;
}
.tick {
font-size: .725em;
font-weight: 200;
}
.tick line {
stroke: #aaa;
stroke-dasharray: 2;
}
.tick text {
fill: #666;
text-anchor: start;
}
.tick.tick-0 line {
stroke-dasharray: 0;
}
.x-axis .tick text {
text-anchor: middle;
}
.path-line {
fill: none;
stroke: rgb(0,100,100);
stroke-linejoin: round;
stroke-linecap: round;
stroke-width: 2;
}
.path-area {
fill: rgba(0,100,100,0.2);
}
</style>