<script>
import { scaleLinear } from 'd3-scale';
const points = [
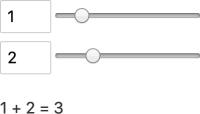
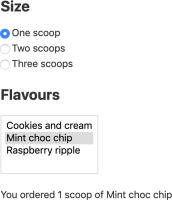
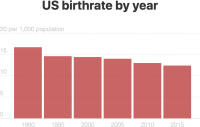
{ year: 1990, birthrate: 16.7 },
{ year: 1995, birthrate: 14.6 },
{ year: 2000, birthrate: 14.4 },
{ year: 2005, birthrate: 14 },
{ year: 2010, birthrate: 13 },
{ year: 2015, birthrate: 12.4 }
];
const xTicks = [1990, 1995, 2000, 2005, 2010, 2015];
const yTicks = [0, 5, 10, 15, 20];
const padding = { top: 20, right: 15, bottom: 20, left: 25 };
let width = 500;
let height = 200;
function formatMobile(tick) {
return "'" + tick.toString().slice(-2);
}
$: xScale = scaleLinear()
.domain([0, xTicks.length])
.range([padding.left, width - padding.right]);
$: yScale = scaleLinear()
.domain([0, Math.max.apply(null, yTicks)])
.range([height - padding.bottom, padding.top]);
$: innerWidth = width - (padding.left + padding.right);
$: barWidth = innerWidth / xTicks.length;
</script>
<h2>US birthrate by year</h2>
<div class="chart" bind:clientWidth={width} bind:clientHeight={height}>
<svg>
<!-- y axis -->
<g class="axis y-axis">
{#each yTicks as tick}
<g class="tick tick-{tick}" transform="translate(0, {yScale(tick)})">
<line x2="100%"></line>
<text y="-4">{tick} {tick === 20 ? ' per 1,000 population' : ''}</text>
</g>
{/each}
</g>
<!-- x axis -->
<g class="axis x-axis">
{#each points as point, i}
<g class="tick" transform="translate({xScale(i)},{height})">
<text x="{barWidth/2}" y="-4">{width > 380 ? point.year : formatMobile(point.year)}</text>
</g>
{/each}
</g>
<g class='bars'>
{#each points as point, i}
<rect
x="{xScale(i) + 2}"
y="{yScale(point.birthrate)}"
width="{barWidth - 4}"
height="{yScale(0) - yScale(point.birthrate)}"
></rect>
{/each}
</g>
</svg>
</div>
<style>
h2 {
text-align: center;
}
.chart {
width: 100%;
max-width: 500px;
margin: 0 auto;
}
svg {
position: relative;
width: 100%;
height: 200px;
}
.tick {
font-family: Helvetica, Arial;
font-size: .725em;
font-weight: 200;
}
.tick line {
stroke: #e2e2e2;
stroke-dasharray: 2;
}
.tick text {
fill: #ccc;
text-anchor: start;
}
.tick.tick-0 line {
stroke-dasharray: 0;
}
.x-axis .tick text {
text-anchor: middle;
}
.bars rect {
fill: #a11;
stroke: none;
opacity: 0.65;
}
</style>